Here follow some examples of quantitative analysis I have applied to a selection of philosophies that can be used in portofolio optimization. The optimization of the different portofolios exposed here is with respect to risk-minimization and maximizing the growth of the invested capital. With risk we here mean the statistical variance of the predicted return.
Four different investment philosophies have been put to the test here. This has been done by means of simulating the evolution of capital invested in a portofolio consisting of 20 different stocks. The statistical data used here has been taken from the Large and medium cap Stockholm OMX stock exchange. The four different investment strategies have the following in common:
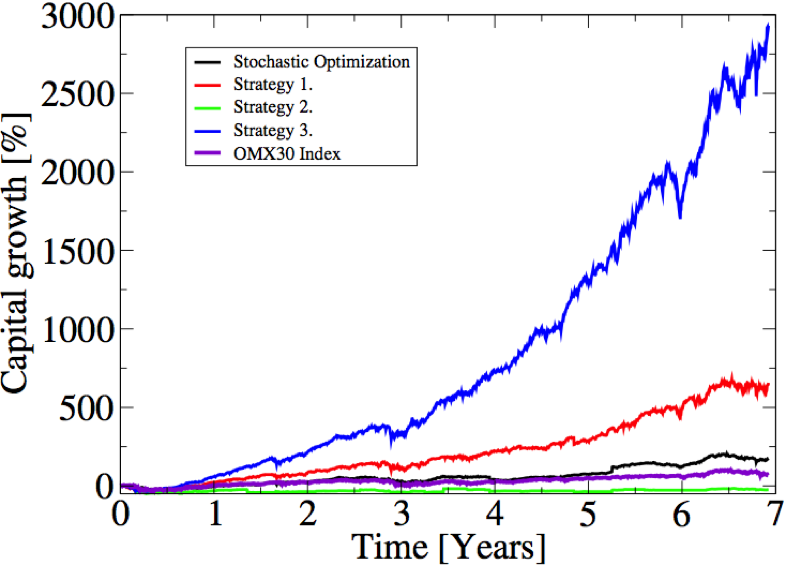
After the initial selection of the stocks according to their respective philosophies, the distribution of capital between the selected stock in the portofolio is done in such a manner to minimize the risk. ( See for instance the book "Mathematics for Finance" by M. Capinski and T. Zastawniak) Here no short selling has been allowed. The statistical data used for the analysis and optimization were the historical OMX stock data 30 days prior to the days of the re-optimization decisions. In the top figure the portfolios have been re-optimized once every day. Furthermore, in order to simplify the simulations, courtage has been neglected and fractional ownership of stocks has been allowed. The results of the simulations of these strategies are shown in the topmost figure of this page.
(I) DEFINITION OF THE STRATEGIES:
For information on the strategies used here to construct the 4 different portfolios please contact me (see contact information at the bottom of the page)
(II) RISK ANALYSIS OF THE DIFFERENT STRATEGIES:
We now expose the risk of the different strategies (a-d) using an alternative methodology. This is done by modifying the re-optimization step of the portfolios by introducing a metropolis step based on the individual variances of the stock. By doing this we first of all bias the calculations towards minimizing the risk over maximizing the profit, but also, we simulate the uncertainty (or lack of trustworthiness) of the statistical data upon which the different strategies base their decisions. This enables the estimation of the risk coupled to each strategy by analyzing the variation of growth for an ensamble of calculations using the same strategy.
Below the calculated growth-distributions for the four stochastically challenged strategies are shown. Here the statistical data gathered from the OMX stock exchange between 2008-08-14 to 2015-10-09 has been used to calculate the correlation matrices at each and every timestep. The growth-distributions has been calculated by sampling the growth from 50 different simulations for each of the strategies. Here the portfolios have been re-optimized each day. The color coding goes from blue (low probability of a particular return) to read (high probability of a particular return). By clicking on the figures below you can also see the 3-D representation of the growth-distributions.
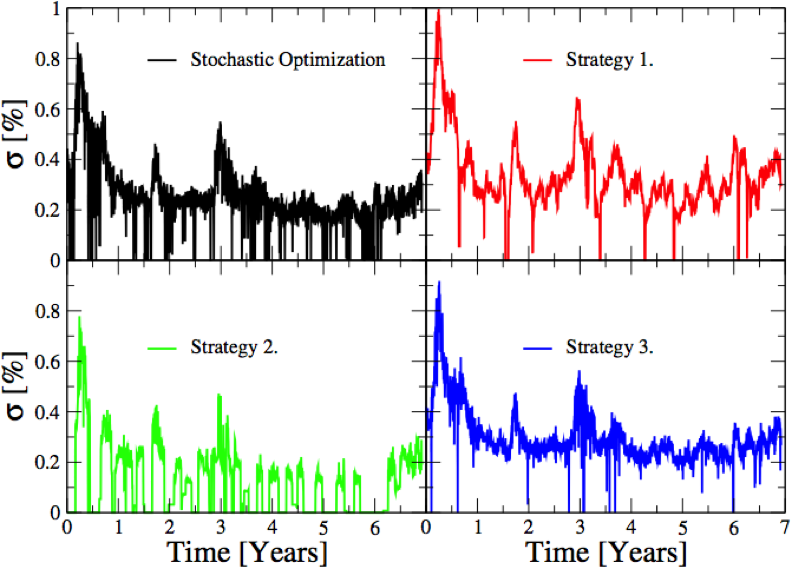
We start of by examining the risk by the standard approach, i.e we study the standard deviation for the growth of the portfolios. Below we show the variance for the portfolios optimized according to the strategies previously defined.
From the above variance curves we come to the conclusion that the "the "Stochastic Optimization" strategy is as risky as any of the other 3 strategies. However, since the "Stochastic Optimization" strategy is stochastic by construction we cannot trust it to be as safe as the above curve suggests. In order to properly estimate the risk of this strategy we need to employ an alternative approach.